There have been two initiatives recently to gather data from the Ethereum community in the form of text-based questions and interviews. Status has also been doing a lot of UX research and gathering all kinds of user data.
All this data needs to be analysed closely and shared with the public in an easy-to-understand way such that everyone interested in Ethereum can see directly what the biggest needs are, what really matters to people in the community, where the best opportunities are, what the most widely-used tools are, and where to find the most insightful and educational resources.
We have begun that here.
When it comes to data visualisation, you have several ways to analyze text.
- Word clouds: great for analyzing frequency and sharing punchy insights.
- Topic modelling, which can be broken down into three sub-fields:
- Supervised: A human says “This is a dog, this is a cat etc”. Generally gives the most accurate results, but is time consuming and can be very biased.
- Unsupervised: The machine comes up by itself with the cluster. A humans says, “We have this kind of text, find some kind of structure”.
Say we want to analyse visitors to website coming between 9-2pm, or 5-8pm from US or Canada. The model can do this - and find patterns we may not have been expecting at all - but it is then up to us to interpret why we have these kind of patterns.
This is what we are trying to do with the interactive visualisations. - Semi-supervised: A human specifies, “There is a business, there is something called ‘dinosaurs’” and then tells the model: “try to find something that matches”. This is what we are doing for the word clouds: i.e. telling the model to focus on important words like “web3”, or teaching it that “VS == Visual Studio” and then setting it off to calculate the frequency and patterns by itself.
- For more numerical datasets, there are a tonne of other graph-like visualisations to play around with. We’re not sure that many of these could be applied to such text-heavy and unstructured data, but are thinking about how to show in an interactive way the key things that were said about certain topics.
This means choosing something like “Truffle” and hopefully being able to show both that testing and prototyping is easy, but that adapting it for complex use cases is harder.
So, how do we actually do this for EIP0 and ETHPrize (and all the other datasets to come)?
Sentences are broken down into “tokens” (i.e. individual words), which are organised in associative arrays. We then calculate the frequencies of these tokens and assign weights to them probabilistically to map out the interactive visualisation showing circles of linked ideas.
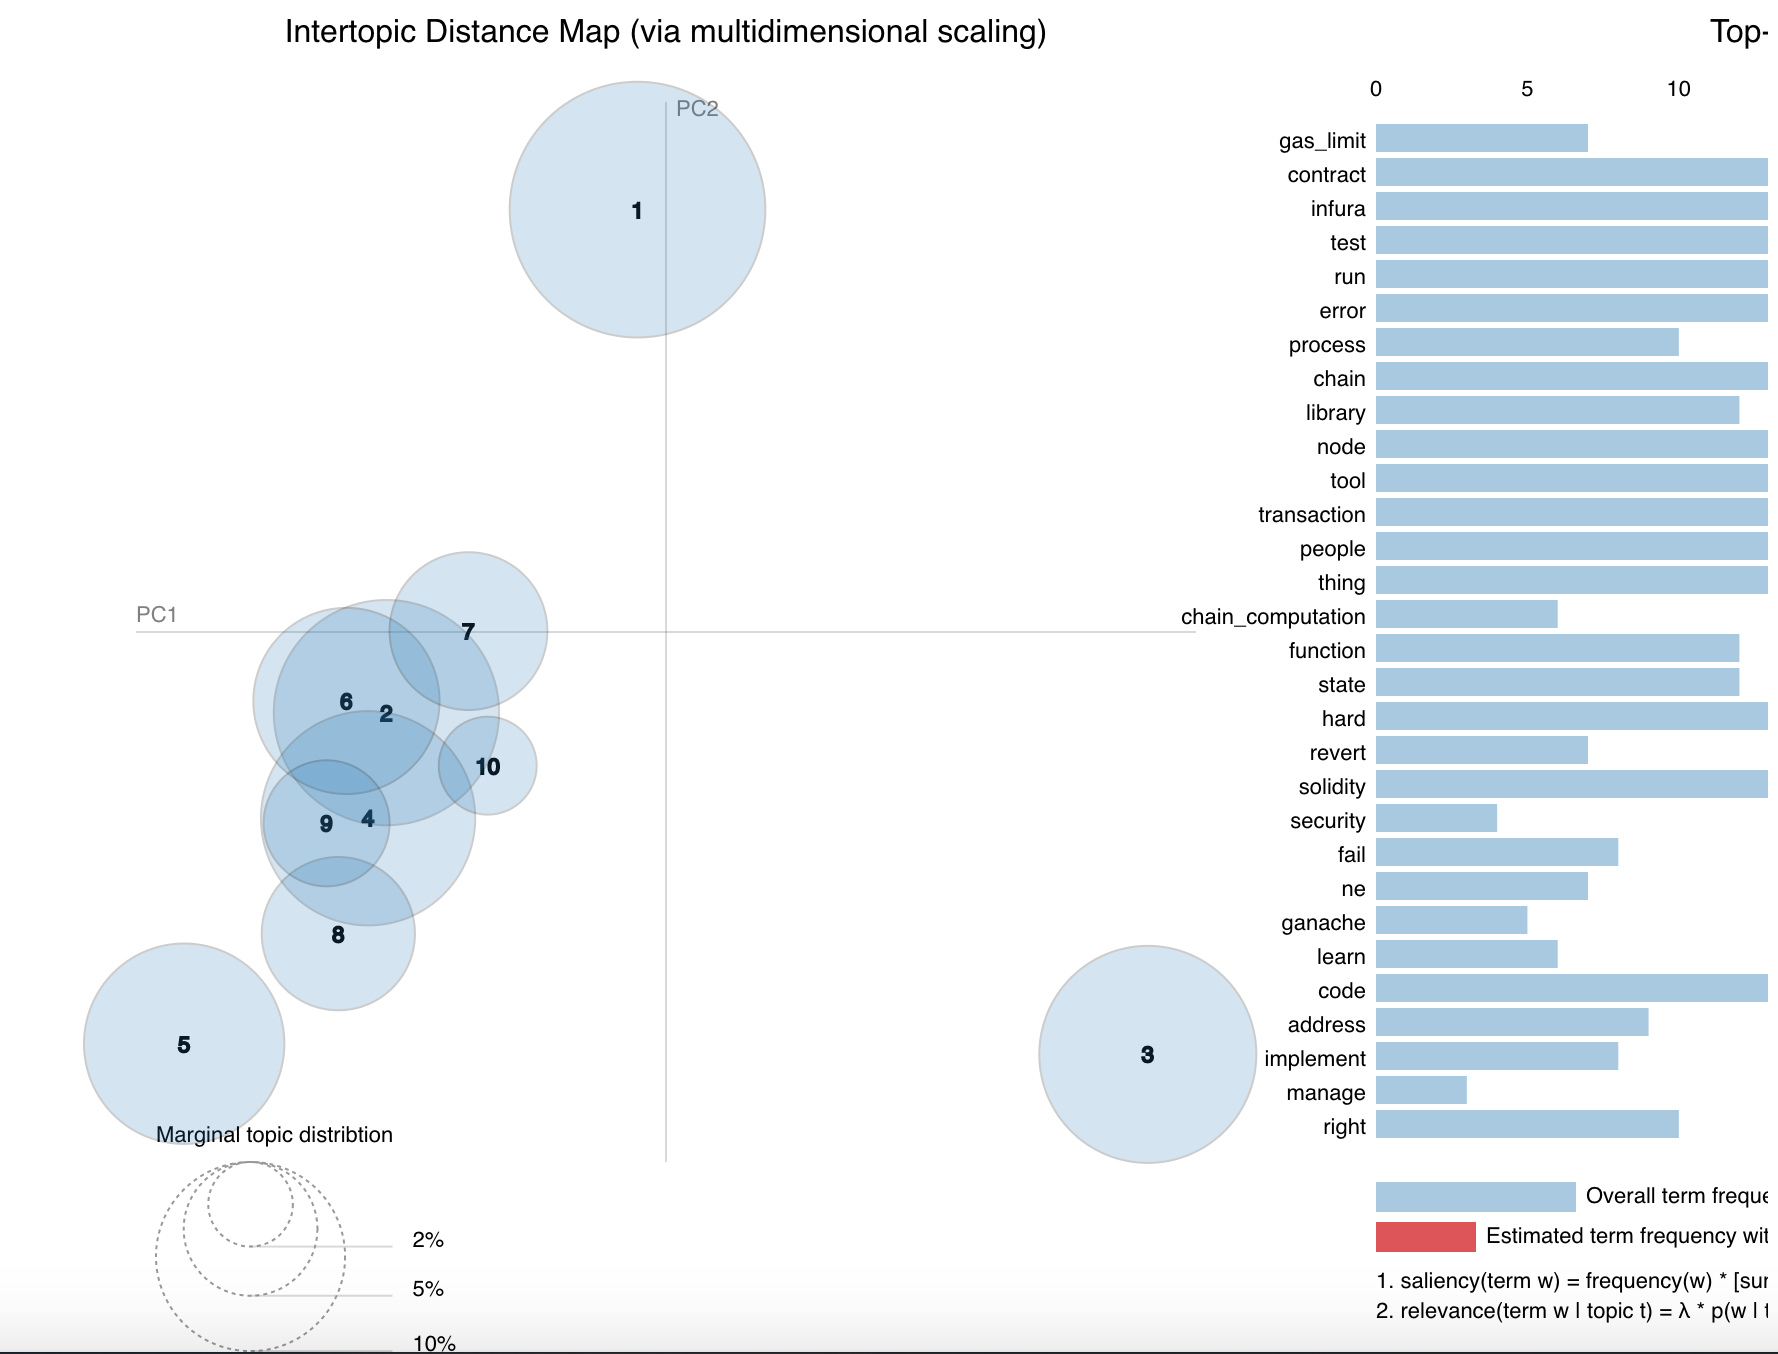
You might be asking, “What do the positions on the graph really indicate? And why do they become red when I hover over them and show up different bars on the accompanying chart?”
The size of any given circle indicates the weight of the topic in the whole dataset (closely related to the frequency with which certain terms were mentioned, shown in the red bars on the chart). You can use these frequencies, when the data is highly correlated, to decide on names and categories with which to understand the patterns discovered in the data more easily. Data still needs interpretation…
The actual positions of the circles on the graph have to do with something called the Principal Component Analysis.
- You transform the data into its “principal components” - which means changing the base along which you view it. You can split the data along any number of axes, but 2 or 3 are obviously easiest to visualise. The idea when doing this is to split the axes in such a way that it captures the most variance between the data.
- A full description of what Principal Component Analysis can be found on Wikipedia but I recommend this visual example.
- The circles are then mapped in the same plane as the principal components.
- pyLDAvis is used for the visualisation.
Even though this is cutting edge stuff, there are no fancy neural networks at this stage. It’s also just difficult to handle the data, because it is totally non-numeric and unstructured. However, there are still some really cool things we can do.
We first need to do some manual tagging that will help the model identify what is important and focus its search for patterns around certain things we have taught it.
We use a library called Spacy, which is a neural network model trained on a dataset called Common Crawl from all web pages that are available in the world (literally growing by terabytes every month!). It’s made up of blogs, news and comments in English, all tagged manually (somehow?).
By tagging the data and training the model a bit and by using awesome libraries like Spacy, we can, for instance, build things that recognise only names in a text, and include them in a word cloud as opposed to the (prettier, but more scattered) one Alex van de Sande did.

Which is cool, if you understand Ethereum, but not so helpful without a lot of context, which is exactly what we want to avoid. So we tag the data, run it through a neural net and produce the below:


The Really Big Idea
Even more exciting, we can create a dataset trained on GitHub, ethresear.ch, ethereum-magicians.org, Medium, developer news and tooling sites etc. and continually pull data in to analyze, as this sort of methodology scales very well.
Decentral-AI-ze all the things!!