72% of you filled in the recent organisational analysis survey (thank you!)* - we looked at some of the initial data yesterday in the unconference sessions, and wanted to share more broadly here for others. The results can show us a lot about how Status operates, interacts and communicates as an organisation.
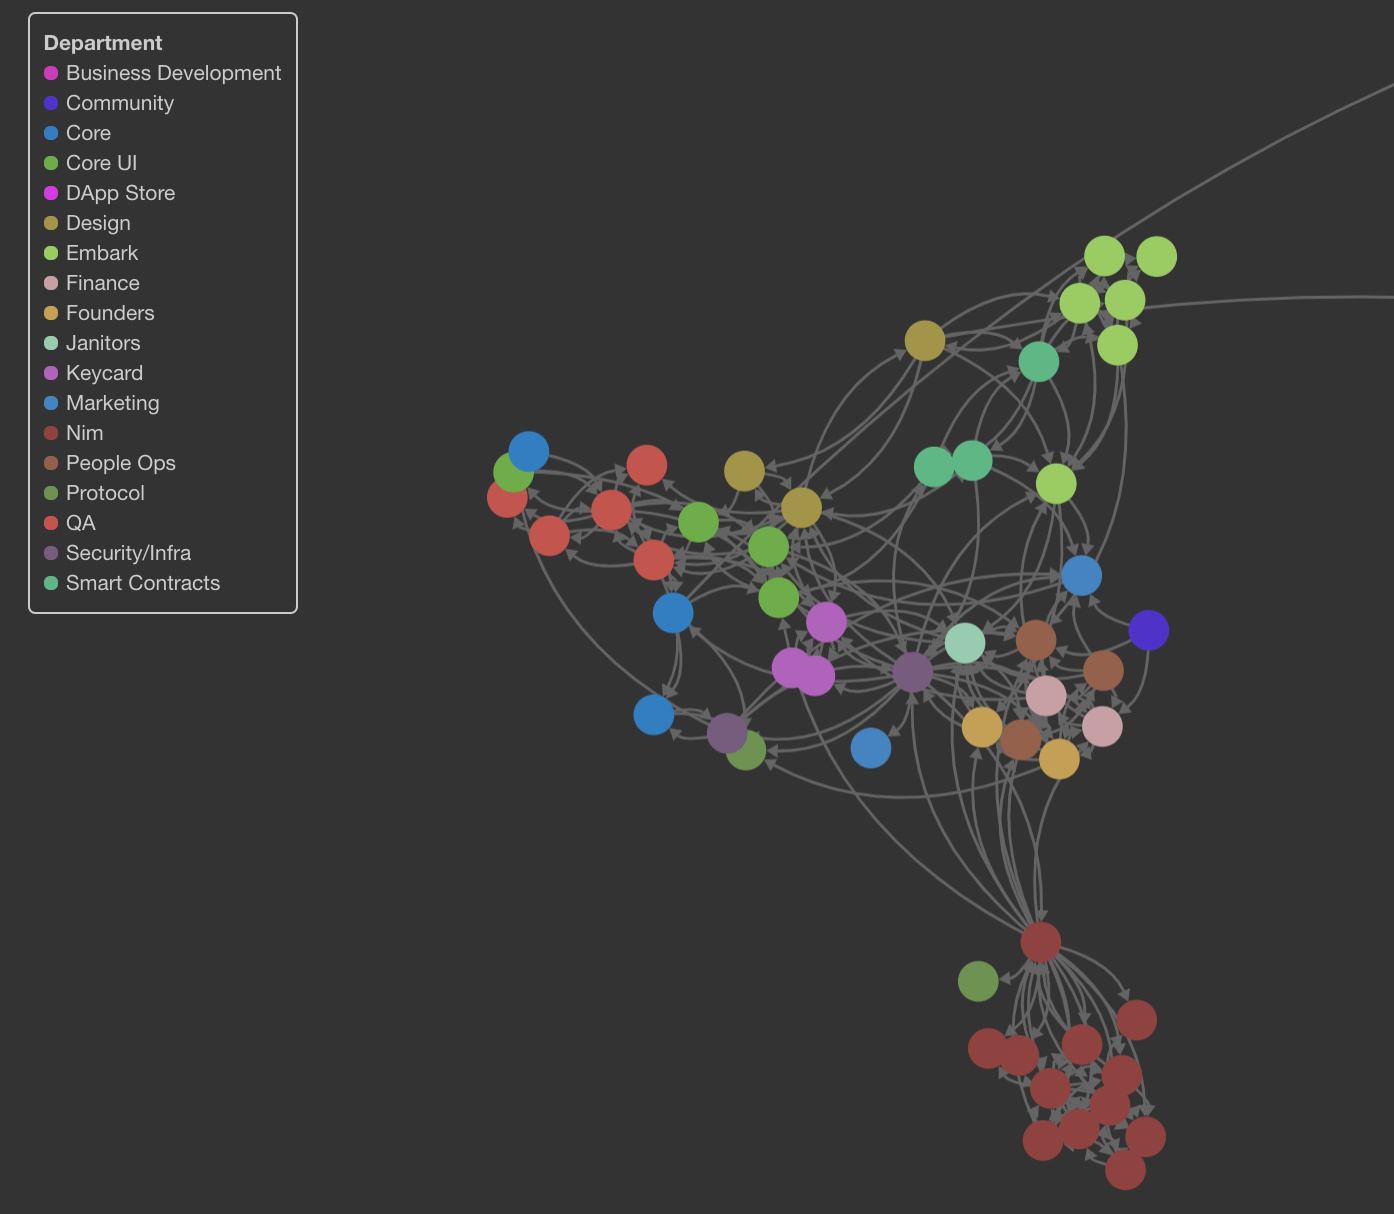
A good example is this view - focused on who we share information with:
In this map, the Embark and Nimbus teams are clear clusters with critical nodes (Iuri and Jacek respectively) that share information between the teams and the rest of Status.
You can view the network maps for 3 broad questions here:
There are a bunch of options to filter & modify the networks based on multiple criteria - feel free to play around with them (please share any interesting findings).
In our session yesterday, we discussed:
Identifying critical nodes to the organisation (with the insight that they may also be at risk of being overloaded)
The unique challenges that remote working brings to an organsation likes ours - where we may miss out on the “watercooler” moments that help create cross team connections.
How to create more connections between teams/groups (especially where none seem to exist) - and the role that Slack & Desktop have played in creating or breaking some of the connections.
The risk posed by having “critical” nodes in our network (i.e an over-reliance on one person) and one potential solution being a “documentation week” where we try to document all process etc to ensure continuance when a team member is sick/on vacation/leaves.
The hope that the week in Istanbul will strengthen connections across teams, and how we should/could schedule similar events to continue to develop the connections. BUIDL week was cited as a good example.
Further comment/insight welcome!
*If you haven’t filled in the survey, you still can do, and I can update the network maps.
This is a very interesting tool. Would be nice if the people that didn’t answered also did so, so we can have a 100% complete view of the contributors community. It was very painful to answer this questions because they were so many, and it would worth more if everyone does it.
For the Quality of Relationship scheme I recommend using filters to reduce the amount of weight on the connections, so you can have a better view of the data on separated weights, The data for this one can be a 'lil messy because too many connections but I guess this is a healthy sign.
For the Problem Solving we can visualize the flow of responsibility. When there are uncertainty, this is the flow, which shows who are the people taking contentious decisions (e.g. fee of ens usernames registration) .
Sharing Information network data can be used to improve our meetings and chat rooms. Currently I am always being able to find many information I need by using public information on our communities, but a few I am have to look into source codes or try and error, which I feel is OK due the cutting edge nature of what we are building.
Would love to hear from @arnetheduck and @iurimatias their thoughts on this, in particular re:
How to create more connections between teams/groups (especially where none seem to exist) - and the role that Slack & Desktop have played in creating or breaking some of the connections.
The risk posed by having “critical” nodes in our network (i.e an over-reliance on one person)
… being critical nodes on two teams in their own distinct clusters. Do these feel like issues for you, or are you happy with how the team is positioned currently?
Same question also for people in those teams who aren’t Jacek & Iuri
In the case of Nimbus, I would not necessarily be concerned at this stage - this is largely due to the nature of the project: it has fairly clear and well-defined goals that until recently had little overlap with any of the other things going on in the organization - the isolation at prevents distractions and lowers the coordination tax which I’d see as net positives up to now - it is not a case of closed doors but rather the house being across town.
Also, this will change as we start integrating/actually using Nimbus - expect there to be more connections as integration with Embark and App starts happening. If the graph looked the same a year from now, I’d look into it.
In terms of bus factor, it is indeed the case that the nimbus team is growing slightly too large for a single coordination point - we will slowly be restructuring and adapting it as the project enters a new phase. A benefit of being an open-source and asynchronous project is that by default, a lot more information is available in written form - recovering from a critical node failure is easier straight off the bat. It would be interesting to see something more tangible here in terms of research - and whether these are actual problems.
Before pointing to slack as the culprit, it would be worth thinking about whether we need more low-density communication channels (like slack) or a culture more centered around structured ones (like discord/documentation), and then consider how else we can build new bridges most efficiently. Tools can only bring you so far before returns are diminishing, and if it’s social factors we’re addressing, slack is not necessarily the answer (vs meeting up in meatspace or other similar exercises for example).